Google Analytics is a powerful tool for tracking website traffic and understanding user behaviour. Here’s a step-by-step guide on how to use Google Analytics to improve your website performance.
Step 1: Sign in to Google Analytics
Visit the Google Analytics website at https://analytics.google.com/ and sign in using your Google account.
Step 2: Choose the correct property
If you have multiple properties set up in Google Analytics, ensure you’re looking at the correct one by selecting it from the property drop-down menu in the bottom left corner of the page.
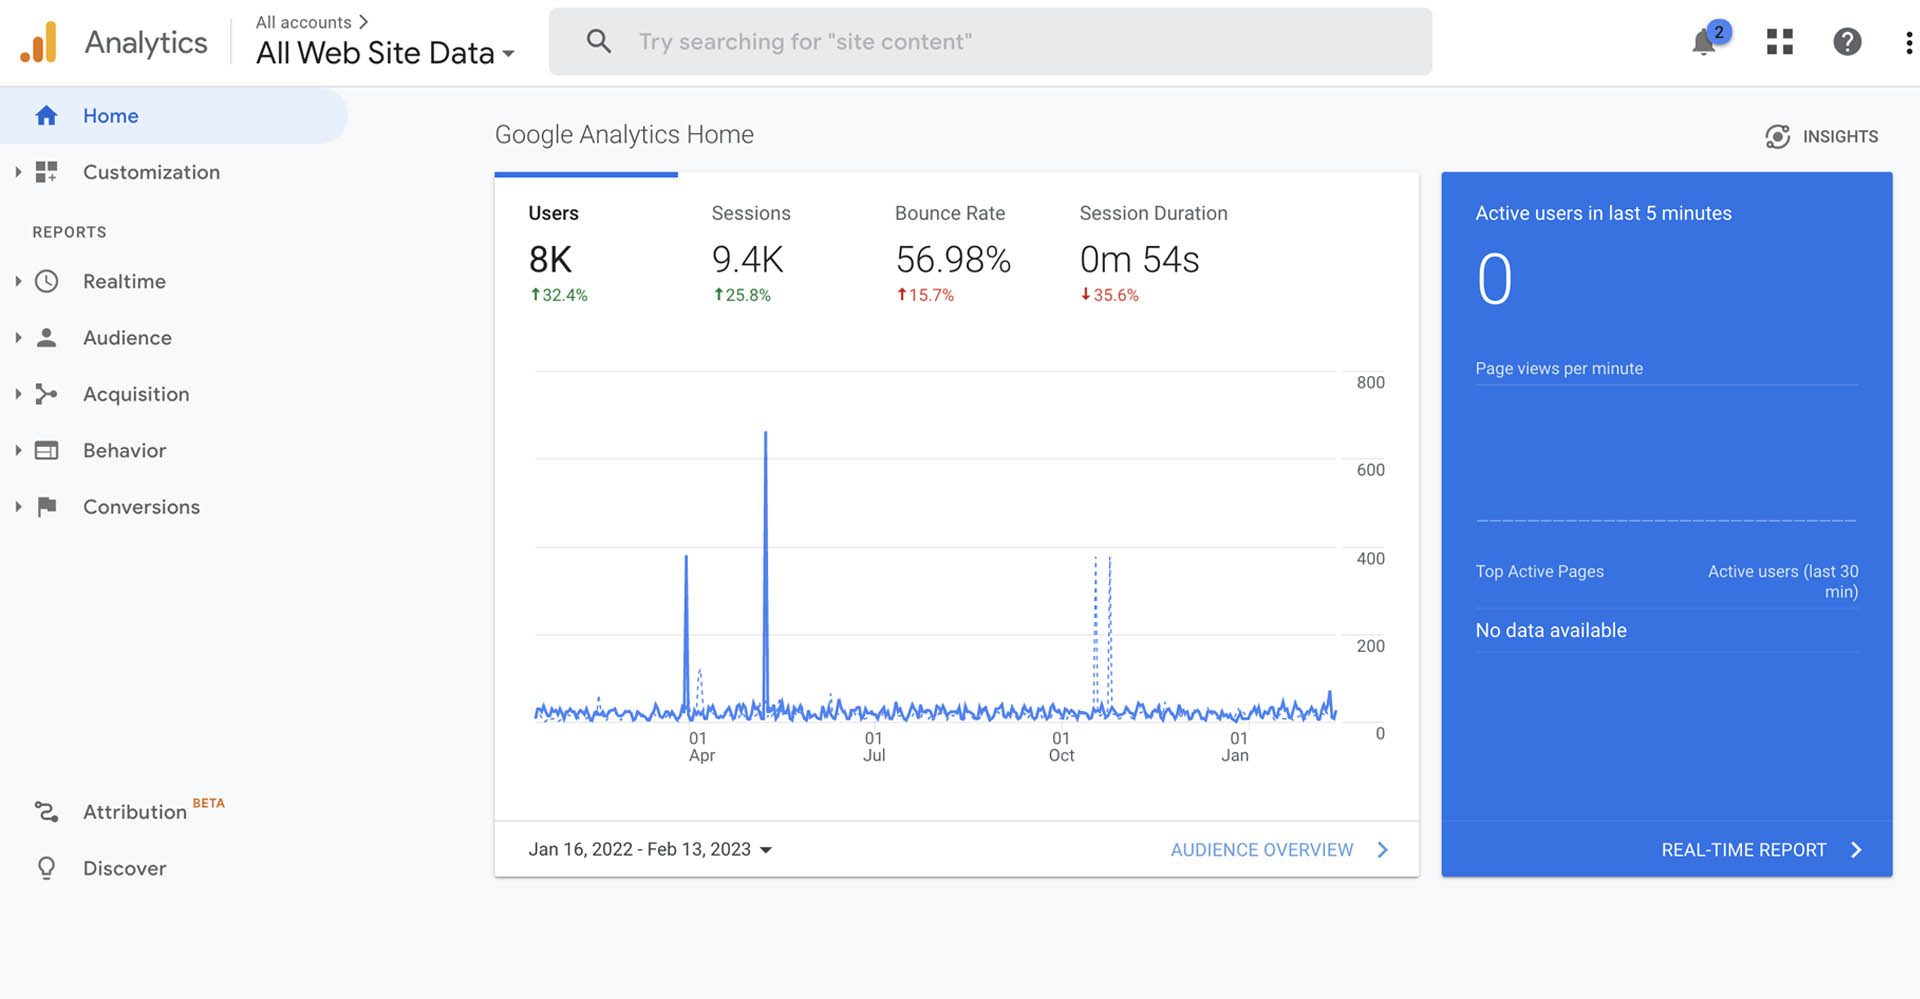
Step 3: Understand the main reports
Google Analytics provides several main reports, including “Real-Time,” “Audience,” “Acquisition,” “Behavior,” and “Conversions.” Familiarise yourself with these reports and understand what type of data they provide.
Step 4: Use the real-time report
The “Real-Time” report shows you the number of active users on your website at any given time, the pages they are viewing and the traffic source. Use this report to monitor website traffic in real time.
Step 5: Analyse audience behaviour
The “Audience” report provides information about your website visitors, such as their location, language, device, and interests. Use this report to understand your audience and make data-driven decisions to improve their experience.
Step 6: Track acquisition sources
The “Acquisition” report shows how visitors find your website, such as through organic search, direct traffic, or referrals. Use this report to understand the effectiveness of your marketing efforts and make improvements where necessary.
Step 7: Monitor user behaviour
The “Behavior” report provides information about how users interact with your website, such as the pages they visit, the time they spend on your site, and the bounce rate. Use this report to identify areas for improvement and optimise your website to engage your audience better.
Step 8: Track conversions
The “Conversions” report shows you the number of conversions (e.g., purchases, form submissions) made on your website. Use this report to understand the effectiveness of your website and identify areas for improvement.
Step 9: Use custom reports
Custom reports allow you to view the data that is most important to you. For example, create custom reports in the “Customisation” section of Google Analytics by selecting “Create Custom Report” and defining the dimensions and metrics you want to track.
Step 10: Analyse your data regularly
Set aside time each week or month to analyse your data in Google Analytics. Use the default or custom reports to understand your website traffic and user behaviour and make data-driven decisions to improve your online performance.
Congratulations, you’re ready to use Google Analytics to track your website traffic and improve your online performance! Use this guide as a starting point and continue to learn and explore the features and capabilities of Google Analytics.
/re